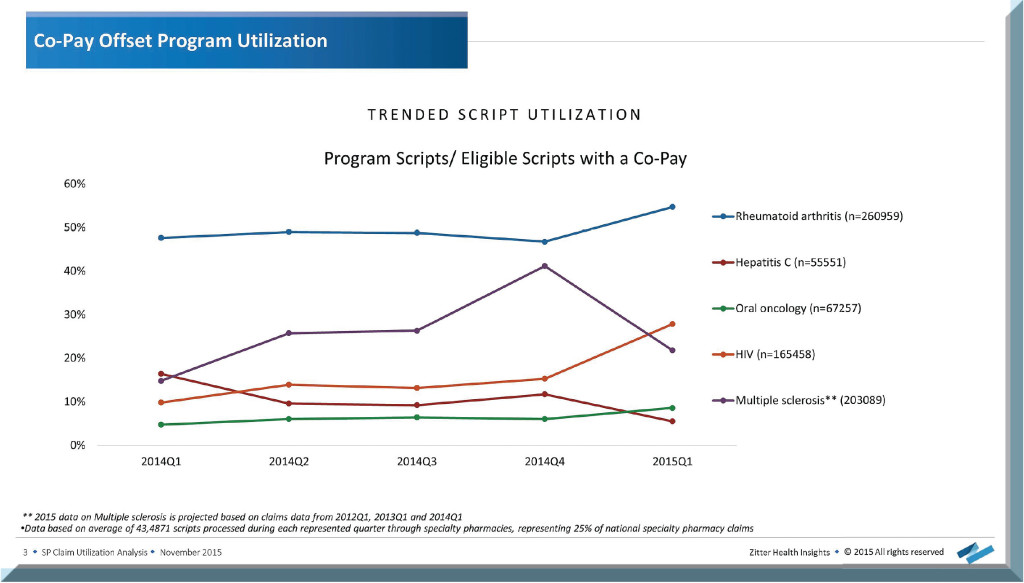
Zitter Health Insights, a healthcare research firm, examined prescriptions processed through specialty pharmacies during each quarter of 2014 (as well as the first quarter of 2015) in order to take a closer look at the use of co-pay programs. More specifically, they focused on five therapeutic areas: Rheumatoid arthritis, Hepatitis C, multiple sclerosis, oral oncology and HIV.
As shown in the figure below, of those five, rheumatoid arthritis has the highest utilization of co-pay offset programs, while co-pay program use for HIV sharply increased in 2015. One important note: Even though the chart shows a sharp decrease in program use for MS, that data was based on projected claims rather than actual scripts processed.
For four of these therapeutic areas, Zitter went a step further by examining an of average of 525,000 scripts processed for each to determine the average savings to the patients as well as the average amount the manufacturer covers in order to decrease patient’s out-of-pocket (OOP) costs.
Rheumatoid Arthritis
Zitter found that RA co-pay program utilizers are receiving more program benefit in Q1 and gradually receive less throughout the year:
- In 2014Q1, on average patients pay $81 for treatments that don’t use any kind of co-pay program, while co-pay program utilizers only pay $12 (with the manufacturer covering $263 of the cost).
- 2014Q2 decreased to $42 vs. $8 (manufacturer covers $133).
- 2014Q3 decreases again to $33 vs. $7 (manufacturer covers $127).
- 2014Q4 was relatively the same as Q3, but in 2015Q1 the costs jump back up to $81 vs. $8 (manufacturer covers $318).
Oral Oncology
Manufacturers are willing to cover even more of the costs for oral oncology treatments in order to offer a much lower OOP price to patients:
- In 2014Q1 non-utilizers pay $205 vs. $38 (manufacturer covers $888).
- 2014Q2: $95 vs. $34 (manufacturer covers $604).
- 2014Q3: $84 vs. $38 (manufacturer covers $563).
- 2014Q4: $85 vs. $34 (manufacturer covers $456).
- 2015Q1: $186 vs. $30 (manufacturer covers $816).
Multiple Sclerosis
Manufacturers are willing to pay a significant portion of a patient’s co-pay—even ensuring an OOP cost in the single digits following Q1:
- In 2014Q1 non-utilizers pay $87 vs. $15 (manufacturer covers $423).
- 2014Q2: $35 vs. $7 (manufacturer covers $195).
- 2014Q3: $32 vs. $6 (manufacturer covers $171).
- 2014Q4: $36 vs. $2 (manufacturer covers $172).
- 2015Q1: $85 vs. $9 (manufacturer covers $590).
Hepatitis C
Unlike in the three other therapeutic areas in which manufactures cover less following Q2, the cost actually goes up for Hepatitis C treatments:
- In 2014Q1 non-utilizers pay $36 vs. $53 (manufacturer covers $325).
- 2014Q2: $29 vs. $18 (manufacturer covers $238).
- 2014Q3: $38 vs. $14 (manufacturer covers $293).
- 2014Q4: $38 vs. $6 (manufacturer covers $442).
- 2015Q1: $58 vs. $22 (manufacturer covers $858).