As is often the case, it’s not a single driver that shapes a trend but rather a confluence of many. This month we look at the fascinating world of leading indicators predictive modeling and how product managers can harness its insights to better understand the drivers of brand choice.
Economists use a host of leading indicators to gauge the economy. These are the early warning signs of change—things such as the stock market, manufacturing activity, retail sales, inventory levels, housing sales, new business start-ups and many others. By following recent data on these metrics, economists have a means of monitoring where things are headed in terms of future economic performance. This gives them a leg up in taking corrective action earlier.
As a pharma brand manager, you constantly make decisions about how to better the performance of your brand. You also probably use TRx volume data to track that performance. Although these data are useful at pinpointing a slowdown in sales, they do not really tell you where your product is headed tomorrow. This is just the limitation of using historical data to make forward-looking plans. The real challenge is to identify those metrics that actually drive future performance.
What may surprise you is that some of the metrics you are already tracking may be leading indicators for your brand.
Much like the economists, if you know how to read leading indicators, you gain greater insight into future performance and a highly reliable means of predicting a downturn. Most importantly, having this information early—before trouble otherwise can be detected—gives more time to take corrective action.
Identifying a Leading Indicator
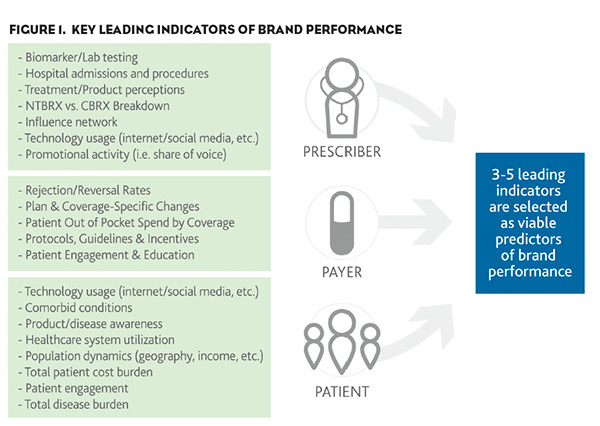
To identify a leading indicator, it is important to understand the cause and effect relationship between brand drivers and performance. You might be surprised at some of the metrics pharmaceutical companies are finding to be reliable leading indicators in predictive models (see Figure 1). We’ve seen correlations with promotional activity, hospital procedures, patient socioeconomics and payer information such as reversals and rejections. In many cases, it may be necessary to look at multiple indicators in unison, much like economists who rely on indices of economic factors. This approach can help increase the forecasting accuracy of any predictive model.
A good model needs to hold up for a period of time in the future so we try to validate it by tracking data for six months after the model is built to see if it continues to track accurately. Once validation is complete, it can be used with confidence as an early warning system for change. Effectively incorporating this information into a strategic planning process allows companies to maximize their investment.
Predicting Brand Performance
To see how leading indicators can be used to predict brand performance, let’s turn to some predictive modeling we did for osteoporosis prescription medication Actonel. The first step was to identify a group of viable leading indicators that we could align with TRx volume data, a good metric to quantify brand performance.
After reviewing 36 months of historical data around Actonel we found four highly promising leading indicators that were aggregated into an index that could be tracked and used to predict TRx volume. Our index for this brand averages two positive influencing indicators—New-to-Brand Rx and Continuing Brand Rx—as well as two negative influencers—New-to-Brand Rejection Rates (when insurance denies a claim at the pharmacy) and New-to-Brand Reversal Rates (when the patient tries to fill a Rx but walks away because co-pay is too high). Using a form of time series regression, we found these indicators to be correlated to TRx volume data with a three-month time delay.
Figure 2 shows the predictive ability of the Actonel leading indicator index over a 27-month period. The blue line tracks the Actonel Composite Index, which is a weighted average of changes in the four indicators relative to benchmarks over the previous four months. This line represents the model’s prediction of percentage changes in TRx volume. The red line represents Actual Percentage Changes in Actonel TRx Volume and can be viewed as how TRx volume actually changes over the following three months.
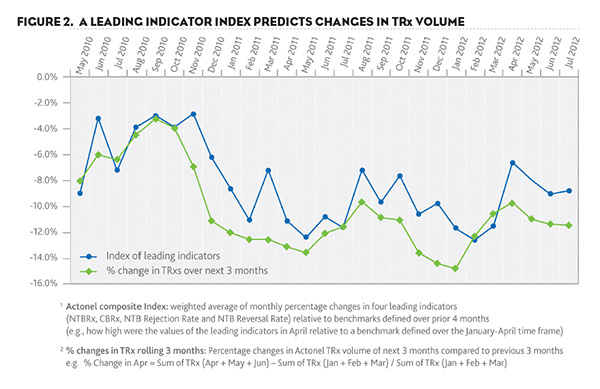
In essence, the blue line shows how well the model is predicting the actual TRx volume trend. As you can also see, the blue line provides a close facsimile of the actual trending of the red line suggesting an accurate time-delay prediction of future performance.
Although this fascinating science is not new, it has made great strides in the past year and is poised to bring new insights to the world of pharmaceutical marketing. Armed with a good leading indicator, you can be in a position to influence future performance.