
Putt’s Law states, “Technology is dominated by two types of people: Those who understand what they do not manage, and those who manage what they do not understand.” Pharmaceutical brand managers generally fall into the second category when it comes to applying sophisticated analytical techniques in designing marketing campaigns and measuring the results. This is to be expected. Most marketers have little formal training in complex statistical methodologies, and many have neither the time nor the interest to learn them on the job. Yet, because multivariate statistical analyses are now an integral part of most pharmaceutical marketing decision-making, marketers should at least be familiar with the techniques that are now available and know when to apply them.
First, A Definition
Multivariate or “many variables” analysis is a body of statistical techniques that have been developed specifically to isolate the important relationships between variables and to highlight the structure behind what might seem to be a chaotic mass of data. They work to:
- Identify patterns of similarity or relationships among many variables;
- Estimate the relative importance of each variable in predicting or explaining some important outcome; or
- Make predictions of important outcomes.
In the hands of a competent analyst, multivariate analyses can simplify interpretation, provide innovative graphical presentations and reveal insights that would be impossible to obtain by simple one- and two-way tabulations. In any large or complex study, these are not esoteric frills, but essential tools to speed up and enhance analysis.
There are two major types of multivariate statistical methods: Those that concern themselves with the dependence of one variable on the others and those that consider all the variables as interdependent.
Dependence Techniques: When a researcher wants to predict, explain or understand one particular variable because it represents a desired outcome for pharmaceutical marketing purposes, it is usually best to apply a “dependence technique” in analyzing the data. In these cases, the variable of particular interest is the dependent variable (Y) because its value depends on the values of all independent variables (Xs) in an equation or model. The objective is to determine both how and how much each independent variable relates to, or explains, the variation in the dependent variable.
Interdependence Techniques: In contrast, no single variable is of special interest in interdependence analysis. All variables are considered independent variables (Xs) that are 1) free to vary and 2) approximately equal in importance or interest for a particular project. In such cases, we are primarily interested in determining patterns of relationships among all variables, usually with the objective of finding groups of variables, objects or people that are similar in terms of a set of meaningful variables. Interdependence analysis can be applied to any or all kinds of pharmaceutical marketing data that can be measured. It is especially useful in identifying market segments that consist of groups of people or companies that are similar in ways that are useful for pharmaceutical marketing planning purposes.
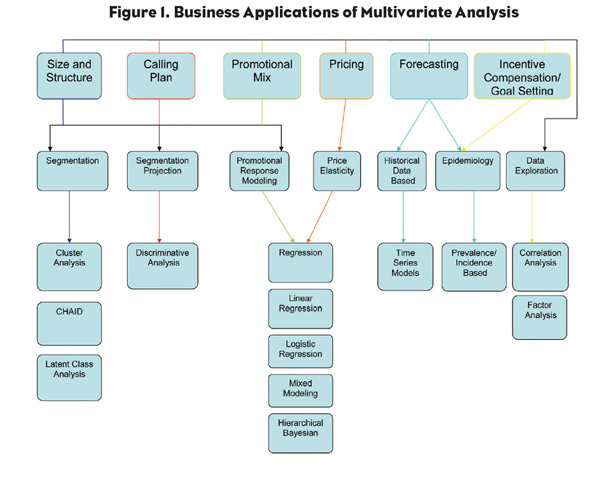
In pharmaceutical marketing research, we often use both dependence and interdependence techniques in the same analysis. Figure 1 shows the broad application of multivariate techniques for achieving specific business objectives such as determining sales force size and structure, developing call plans, optimizing the promotional mix, setting prices, forecasting, determining incentive compensation and setting goals. Note that this is not an exhaustive list of the tools available, but reflects many of the most common.
The Pros and Cons of Each Technique
Each type of analysis has a unique set of strengths and shortcomings and is therefore suited to a different research challenge. The following list examines many—but not all—multivariate statistical methods with an example of the type of specific business issue each could address. This list can serve as a preliminary reference guide for marketers before beginning discussions with market researchers and statisticians.
DEPENDENCE TECHNIQUES
1. Regression Analysis (Multiple Regression, Logistic Regression, Mixed Modeling)
What It Does: Predicts the value of one variable using one or more other variables whose values can be predetermined.
When to Use It: To work out the simultaneous impact of one or more variables at a time; works with binary variables (yes/no responses) as well as numeric variables.
Advantages: Allows you to work out “what if” scenarios to measure how changes in one variable impact other variables.
Disadvantages: Good predictive powers cannot be guaranteed. Inter-correlation of data can mean that not all variables are included in the model.
Specific Business Issue Example: Can measure the impact of detailing and sampling on prescribing behavior.
Sample Research Question: How would it impact our market share if we reduced or increased our details by a specific percent?
2. Discriminant Analysis
What It Does: Predicts group membership for new cases, especially when there are more than two groups.
When to Use It: To classify new respondents into the group or category in which they most likely belong; there can be two or more groups.
Advantages: Much easier to use (and to understand) than logistic regressions for the prediction of group membership, especially when there are more than two groups.
Disadvantages:
1. Assumes normal distribution of groups being compared.
2. Assumed to show approximately equal variances in each group.
3. Patterns of correlations between variables are assumed to be equivalent from one group to the next.
4. Assumes linear relationships between variables in all groups.
5. Extremely sensitive to outliers.
Specific Business Issue Example: Can project the attitudes of a sample of physicians (as measured through primary research) onto the entire universe of doctors.
Sample Research Question: Which physicians will be most receptive to a given message?
3. CHi-squared Automatic Interaction Detector (CHAID)
What It Does: Detects interaction between variables. Can create subgroups of customers on a “dependent” variable where the groups are determined by “explanatory” variables.
When to Use It: To identify discrete groups of consumers and predict how their responses to some variables affect other variables.
Advantages: Highly visual output commonly in the form of an organization chart. No equations.
Disadvantages: Requires large sample sizes so that respondent groups are large enough for reliable analysis.
Specific Business Issue Example: Can segment physicians according to their likelihood of prescribing a product, as determined by several underlying variables.
Sample Research Question: Which physicians should be our top priority?
4. Time Series
What It Does: Time series analysis predicts future values of a variable based on the historical trends.
When to Use It: To forecast a variable’s future value when it is primarily dependent on the variable’s past value.
Advantages: Good at measuring both trend and seasonality through statistical techniques.
Disadvantages: Does not always take into account future changes in the marketplace.
Specific Business Issue Example: Best used to predict the volume of prescriptions that will be written at the doctor level or within any geographic level.
Sample Research Question: What sales should I expect for my product at the national level as well as in each territory?
5. Hierarchical Bayesian
What It Does: A type of regression technique that lets the modeler provide the business insight needed to arrive at a more realistic model.
When to Use It: To analyze primary research data where the information is limited. Provides realistic assumptions.
Advantages: Arrives at individual level models (physicians, payers, etc.) for more granular information.
Disadvantages: Fairly complex and computationally intensive; to be used with large sources of information.
Specific Business Issue Example: In conjoint analysis, where the data collected from primary surveys is limited, these techniques are very efficient in teasing out differences across doctors, payers or patients.
Sample Research Question: Which attributes are important when doctors are making a decision in my therapeutic area?
6. Prevalence/Incidence-based Model
What It Does: Estimates the population with a certain condition, based on prevalence and incidence assumptions.
When to Use It: To forecast the number of customers for a product, based on current customer base and expected new customers.
Advantages: Takes the current population information as well as expected future changes in the marketplace.
Disadvantages: Costly to estimate.
Specific Business Issue Example: Can be used to forecast a new product’s performance.
Sample Research Question: How many patients will have a certain condition in 2008, and how many of them will be using a certain class of drugs?
INTERDEPENDENCE TECHNIQUES
1. Correlation Analysis
What It Does: Looks at the indirect relationships in data; establishes which variables are most closely associated with a given action or mindset.
When to Use It: To objectively assess the extent to which one variable really influences another.
Advantages: Can provide a more discriminatory analysis than asking a direct question.
Disadvantages:
1. Has potential shortcomings when dealing with responses using different scales.
2. Does not give a cause-effect relationship.
Specific Business Issue Example: To quickly understand if prescribing for a product is related to the number of reps promoting the product.
Sample Research Question: Which attitudes of a physician are correlated with their prescribing behavior?
2. Factor Analysis
What It Does: Looks at the relationships between a large number of variables and groups them together in combinations of variables that are closely correlated.
When to Use It: To reduce a large number of variables into smaller, homogeneous groupings.
Advantages: Permits analysis of large numbers of variables that would be too cumbersome and time consuming to analyze individually.
Disadvantages: Some loss of information.
Specific Business Issue Example: In primary market research studies (such as awareness, trial and usage studies) to understand which combinations of product attributes drive doctors’ prescribing patterns.
Sample Research Question: What factors are important and relevant in primary research to segment doctors?
3. Cluster Analysis/Latent Class Analysis
What It Does: Establishes market composition by subdividing it into discrete groups or clusters that can be described in attitudinal or behavioral terms.
When to Use It: To identify different customer groupings based on their similarities on a number of metrics within the market.
Advantages: Provides a more focused profile than can be gained from socio-demographics or other single-dimensional measures.
Disadvantages:
1. While members of each cluster group share the same characteristics, each member is not necessarily identical to every other member.
2. Could yield segments that do not necessarily make business sense.
Specific Business Issue Example: Can be used to segment doctors according to their similarities across selected metrics such as total scripts in the market, brand share, share change, etc.
Sample Research Question: How should I segment my customer base to identify the target lists for various promotional efforts?
Advice to the Brand Manager
As market researchers and statisticians consider the best type of analysis to apply to a given business challenge, brand managers should be prepared to join the discussion, asking the following types of probing questions of the experts:
- What assumptions must we make for this analysis to work?
- Is our sample size large enough to give us reliable results?
- Are we striking the right balance in the tradeoff between study robustness and research cost?
- Can we repeat the analysis easily if we need to?
- How can we be sure that we’ve identified the right variables for study?
The latest analytical techniques can, to a certain extent, remain a “black box” to brand managers. Just as it is not necessary to understand the inner-workings of an electronic gadget to use it effectively, brand managers need not understand the statistical wizardry behind multivariate analyses. They should, however, be familiar enough with the capabilities of each method to appreciate when they can be of service. Each of the multivariate techniques described here is best suited to a specific type of research question. Each technique also has certain strengths and weaknesses that should be clearly understood by the analyst before the results are interpreted.