
The product manager of today is social. After years of seeing respondents to our annual Product Manager Survey demonstrate reluctance to embrace social media due to either regulation or lack of support from higher ups, the project manager of 2018 shows little hesitancy. Not only do they feel social media represents the third best opportunity for ROI, but they also are increasing their use of various social channels across the board with LinkedIn use up 17%, YouTube and Twitter up 12%, Facebook up 8%, and Instagram up 7%.
The product manager of today is payer focused. While physicians still remain a marketer’s top target. Payers are now even with patients in terms of the amount of money marketers devote to reaching each target. That’s because respondents see the payer landscape having a big impact in 2019 and it is hard to blame them when you consider the number of mergers between PBMs and health insurers. Not to mention Trump’s blueprint for lowering drug pricing. While 28% feel Trump’s plan will be much ado about nothing, another 24% believe it will be effective in lowering drug prices and disrupting the market.
But nothing concerns today’s product manager more than the product pipeline. Whether it is because Trump’s pricing plan will mean less money to devote to R&D and innovation or that pharma executives plan to pare down drug development and take a more focused approach, product managers are concerned about the future of the pipeline.
Today’s product manager also knows how to make due with less. Respondents are working with an average marketing budget that is $9.8 million less compared to last year. And yet, marketers are actually more confident in their ability to competitively market their brands with the budgets they are given. In fact, 56% expressed confidence this year compared to 51% last year, despite having almost $10 million less on average to work with. But the product manager of 2018 feels good about their ability to recognize the right opportunities for their brand—using both new and old channels—in order to effectively reach their audience.
PM360 would like to thank everyone who took time to complete this survey conducted online by Litchfield Research, an independent research firm, between July and September of 2018. You can see all of the participants’ companies by clicking the tab below. Or you can dive right in to the analysis provided on the following tabs to learn more about the product manager of 2018 including their salary, where they allocate their marketing spend, and what they really think of Trump’s pricing plan, as well as what trends are not to be missed for 2019.
Industry Breakdown
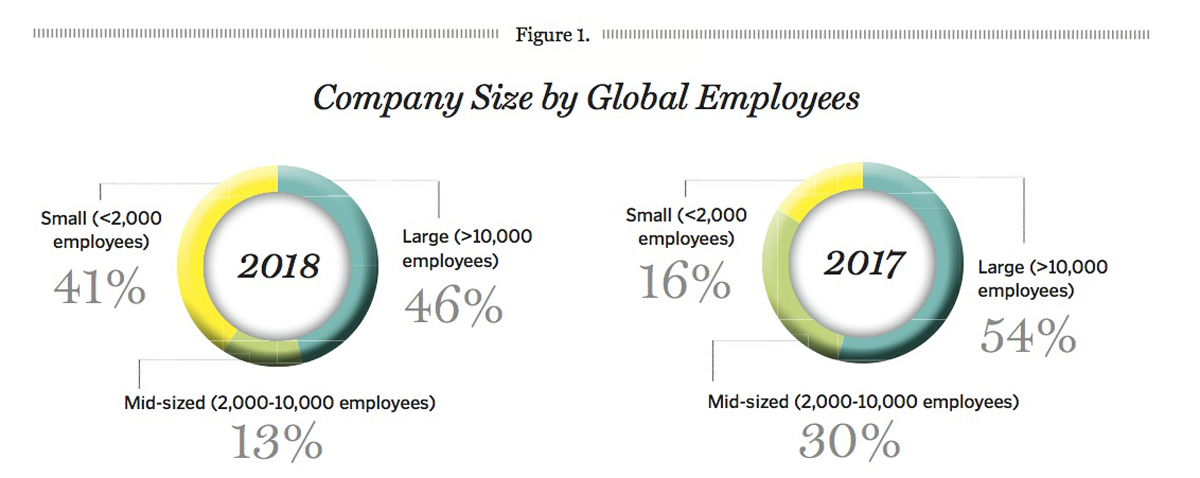
To paint a picture of this year’s respondents, let’s start with where they work. Just over half (55%) reside in the pharma industry, 15% are in biotech, and 16% are in medical devices. The rest work in other areas of the life sciences industry such as diagnostics and health IT. The plurality (46%) work at a large company within their sector, with large being defined as a company that has more than 10,000 employees (Figure 1). That is a bit down from previous years, as we usually see just over half of respondents at a large company. In fact, a big difference between this year’s and last year’s survey is the number of people working at a small company (under 2,000 employees) with a 25% increase in the number of respondents at a small company between 2018 and 2017. That, of course, also means a sharp decline (17%) in the number of respondents at a mid-size company (between 2,000 and 10,000 employees). The fact that more respondents are at smaller companies does seem to have a continuous impact throughout the survey as several answers are different from previous years in areas in which company size could be an influence.
 Experience Level
Another change: The average number of years respondents have spent in the industry has increased by nearly three years. For the most part, the average has been right around 17 years for the past three years—with a high four years ago in 2014 of 17.6 years. But, this year the average is 19.7 years. That may have been skewed slightly by a few industry veterans, including one who said they have been in this industry for 40 years, but overall it appears our average respondent does have a bit more experience. And that level of experience also shows up in respondents’ job titles as we got six CEOs and another three C-suite executives, which combine to be a high for our survey. That does mean we got fewer respondents in lower-level marketing or sales positions such as Directors (30% vs. 43% in 2017), Senior-level Managers (8% vs. 25%), and VPs (17% vs. 21%). But we did get more Product Managers in marketing, sales, research, and analytics positions (28% vs. 11%).
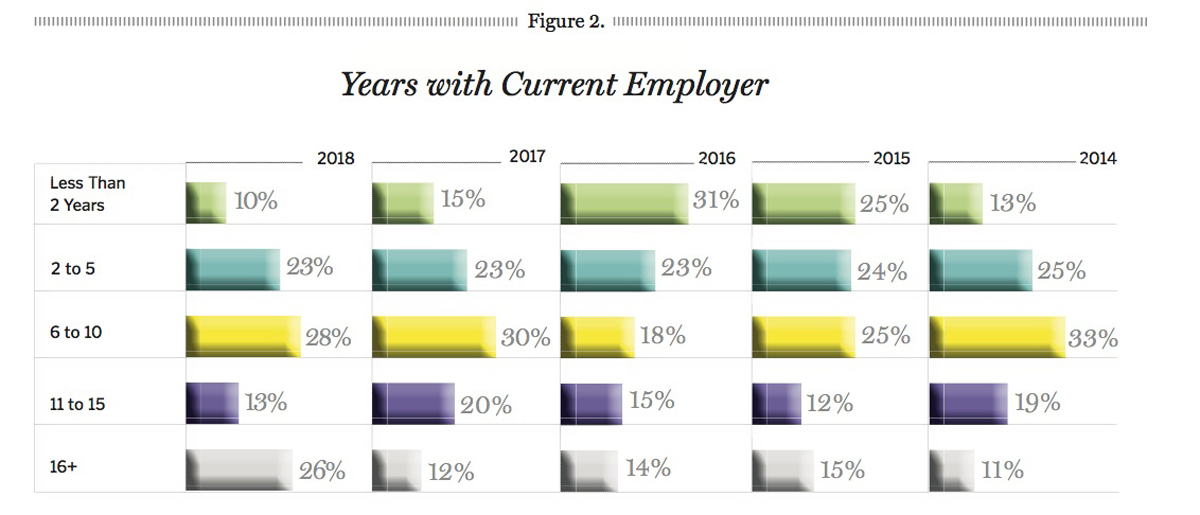
The theme of change continues with an increased level of stability at respondents’ current companies (Figure 2). On average, respondents have spent 8.9 years with their current employer, which is another survey high. The previous high was 7.8 years, which was reported back in 2014, while last year was very close to that at 7.7 years. In both 2016 and 2015, that number was just under 7, so perhaps we are seeing a bit more stability over these past few years.
Salary
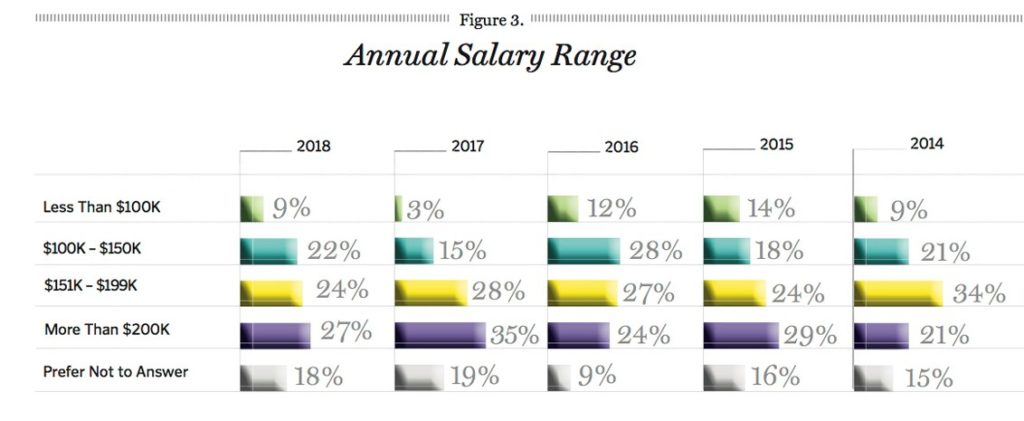
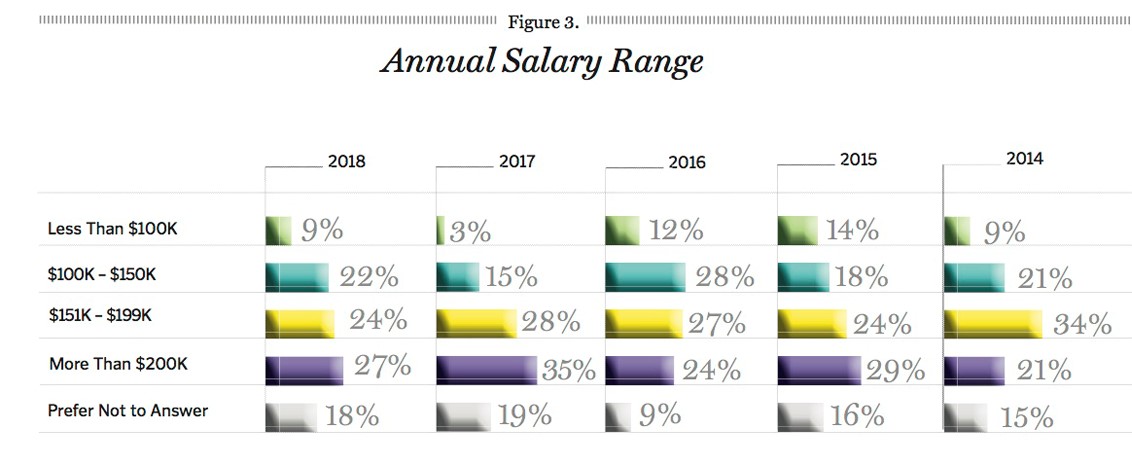
Even with more C-suite executives than ever before, on average respondents reported lower salary levels compared to last year (Figure 3). This year’s mean salary was $155,000, which is right around what we normally see as it was $150,352 in 2016, $153,200 in 2015, and $155,000 in 2014, so the high of $171,400 we saw last year appears to be an aberration. Overall, we saw an 8% drop in those making more than $200,000 (the highest salary bracket we ask about). Combine that with the 13% increase in those making $150,000 or less compared to last year certainly helps to explain the lower mean salary. And that increase could be attributed to the rise in the number of Product-level Managers who responded this year compared to in 2017 when we had more people at Senior, VP, or Director levels. Another factor could be the fact that more respondents are at smaller companies, which could have fewer resources for employee salaries.
 Satisfaction
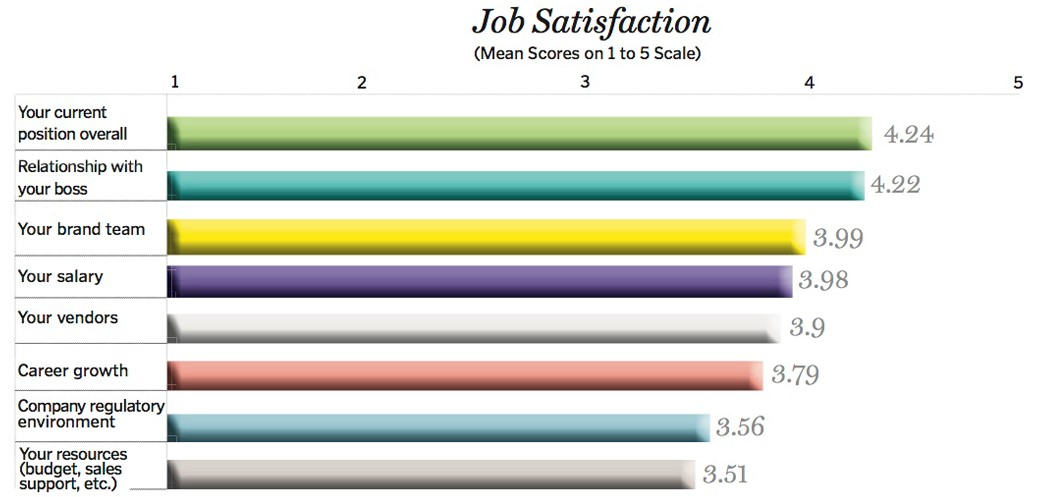
Once again, we asked respondents to rate their job satisfaction in a number of areas. However, we adjusted the scale we ask them to evaluate on from 1 to 7 to 1 (Unsatisfied) to 5 (Very Satisfied) to make it a bit simpler. So we can’t make any apples to apples comparison, but the mean scores of what respondents were asked to rate help shine a light on what is working for them and what isn’t (Figure 4). For instance, their current position overall and relationship with their boss both continue to rank highly. One difference: This year’s respondents were a bit happier with their brand teams compared to the last two years as that ranked the third highest among 2018 respondents compared to fifth highest in 2017. On a more unfortunate note, respondents were not as pleased with their career growth opportunities as that had the fourth highest rating last year, and is down to sixth this year.
 Respondents were also a bit more dissatisfied with their salary, but that shouldn’t be a surprise considering last year had a survey high in salary levels. Vendors, however, came out looking a little bit better rising from sixth to fifth. But that doesn’t mean respondents think their vendors or partners can’t improve in certain areas. When asked what their vendors/partners need to do better, respondents mentioned ideation (52%), presentations (34%), research (32%), selling (20%), negotiations (20%), and also suggested other areas such as execution, strategy, bidding, innovation, as well as “listening to our needs as opposed to reselling off-the-shelf programs” and “presenting tactics that are feasible both financially and capabilities wise.”
Influences
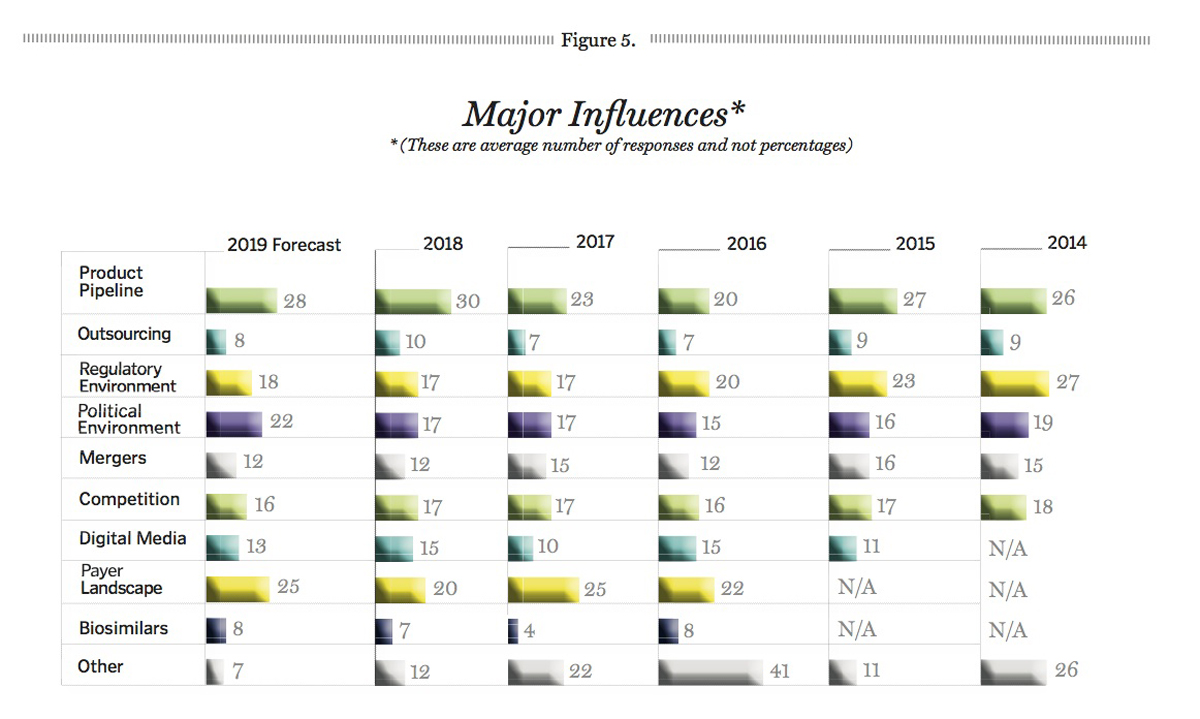
The area that respondents are most worried about having an impact on the industry is the Product Pipeline (Figure 5). As always, we asked respondents to rate the factors that had the most impact on the industry this year as well as to look ahead and forecast their potential impact on the next year. Respondents are given a list of 10 factors, including Other, and told to score each of them so that their ultimate tally equals 100. We then take the mean of each factor’s score. This year, Product Pipeline scored a mean of 30, which was a seven-point increase over the previous year—the largest increase of any of the factors. Last year’s respondents only forecasted the pipeline’s impact to be 23, which was the same score they gave it for 2017.
 Over the past year, we have seen some pharma executives express concern over Trump’s drug pricing agenda impacting R&D and innovation since they would be losing revenue to put towards those areas (something our respondents also mentioned in response to our question about the impact of Trump’s drug price blueprint, which you can read about below). And we have also seen incoming CEOs such as Emma Walmsley at GlaxoSmithKline and more recently (and after the survey had been conducted) Vas Narasimhan at Novartis announce cuts to their drug programs after undergoing a pipeline review. Perhaps, respondents see companies taking a more streamlined and focused approach to R&D and the concern executives have with lower overall profits and are worried about the future of the pipeline.
However, respondents believe the Political Environment has had a similar impact over the past year. So, maybe the concern over the Product Pipeline is due to more internal issues rather than external forces changing how the industry must operate. With that said, respondents are rating the political impact a bit higher at 22 for 2019. That could be a result of some of Trump’s recent announcements about pricing (his proposed changes to Medicare came after the survey finished but his initial blueprint plan had been released) or just the effect of the aftermath of the midterm elections.
Speaking of pricing concerns, while the Payer Landscape rated the highest last year for impact on the industry, it dropped five points to a mean score of 20 this year, which is still second highest. But, respondents do expect it to have a higher impact next year at 25. It is possible respondents just haven’t felt as much of an impact from some of the major mergers between PBMs and health insurers yet, but expect to in the coming years, as well as any impact that comes from Trump’s drug pricing blueprint.
Other factors whose impact has changed over the previous year include Biosimilars, which last year’s respondents rated low. Biosimilars still aren’t considered a major factor, but it is something respondents see as having more of an impact moving forward. As of now, the area most impacted by biosimilars has been autoimmune drugs, as six of the 11 approved biosimilars are for autoimmune therapies. Digital Media and Outsourcing also had more of an impact on 2018 than 2017, but respondents expect both categories to have less influence on 2019.
The Trump Effect
Last year, we asked respondents about Trump’s overall impact on healthcare. This year, we focused it specifically on the impact of his administration’s blueprint to lower drug prices, which was announced in May 2018 (Figure 6). Before anyone looks at the above graph and thinks we’re biased, keep in mind this question was entirely open ended so we didn’t provide respondents with any choices. That means “Not a Good Idea/Trump Doesn’t Know What He is Doing” was not an option we gave people—it was just something 7% of people said. For instance, one respondent said, “Trump is an idiot. Moving the country into the past at the expense of everyone. Disaster.” While another said, “Mr. Trump needs to understand all aspects of the business before just throwing an uneducated answer out there and hoping it works.”
 Ultimately, the plurality of respondents (28%) feel that little or no change will come from this plan. One person said, “A couple of public wins, then no real change unless PBMs get in bed with him. Eew.” But, 28% is far from a majority and almost as many people (24%) felt that Trump’s plan would actually result in lower prices. As one respondent noted, “There will be increased pressure on pharma to hold prices at current levels. Pfizer and AstraZeneca are two examples.” So, yes, it has already caused some companies to hold back on raising prices, though Pfizer CEO Ian Read recently said the company will return to “business as normal” on its drug pricing in January. Some of our respondents also believe that change will only be temporary—one person said the plan “will keep drug prices from climbing as quickly as they have the past few years, but they will continue to climb.”
Others see some longer-term benefits of the plan. “President Trump’s blueprint will give generic manufacturers an opportunity to directly impact individuals and truly make the non-generic manufacturers take a real look at their cost structure, something many do not properly do,” said one respondent. “It will also loosen the ability for collaboration across the board, something we have needed for years!!!” Several respondents also specifically mentioned how this plan could help consumers and have a positive impact on healthcare.
Meanwhile, others are concerned with the potential negative effect on the pharma industry. One person said, “There will be lots of job losses and a mess.” Another mentioned that there will be “confusion, chaos, reduced access for patients, provider pain, and small savings.” And 6% said this could impact the funds put towards R&D or innovation, with another 9% claiming it will force either pharma, PBMs, or both to try to make up the profits by making cuts elsewhere. That includes marketing dollars, as a couple of respondents feel their budgets are likely to be cut. However, one respondent feels this will actually be good for business.
Other ramifications mentioned by respondents include an even greater need to demonstrate value via real-world evidence, more regulations on rebates, increased price transparency, and increased competitive pressure. One person even thinks prices will actually go up as result, but did not indicate why. And, as with many of the things Trump does, some people aren’t quite sure what to make of it. As one person said, “Honestly, with Trump, who knows what will happen.”
Lifecycle
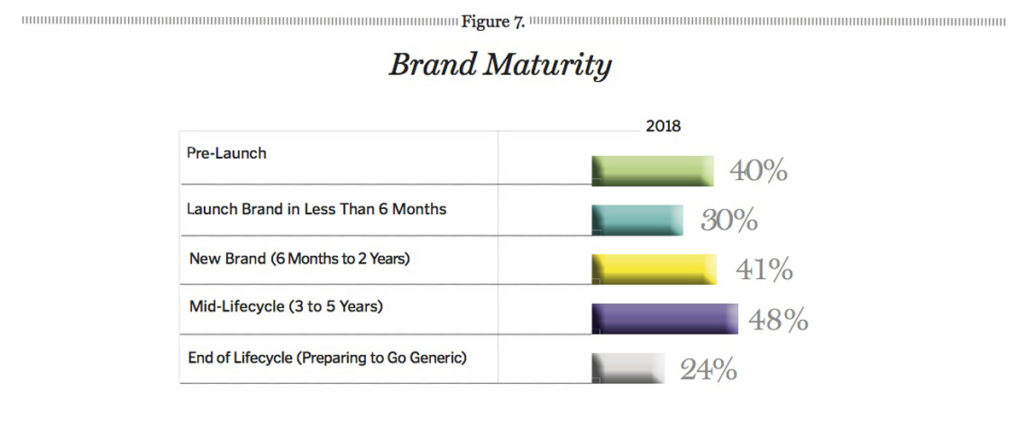
Since product managers are typically responsible for managing multiple brands, we finally let them select multiple answers to our question about where their brands are in terms of lifecycle (Figure 7). Unfortunately, that means we cannot compare these results to past surveys. But we can see that nearly half of respondents (48%) are dealing with a brand that has been on the market for three to five years, and another 24% have a brand nearing the end of its lifecycle, so 72% are working on brands that could be facing generic competition in the next few years. That could be one reason why respondents are more concerned about the product pipeline moving forward. Another 70% are working on brands that haven’t even launched yet, so nearly as many respondents have years to go before worrying about loss of exclusivity.
 Attributes

Marketers are a bit down on how their brands compare to their fiercest competitors. Only 27% rated their brand as “Very Competitive” compared to 31% last year, 32% in 2016, and 34% in 2015. With that said only 3% view their brand as “Somewhat Uncompetitive” and 1% as “Not at all Competitive,” so the vast majority believe they are at least in the fight.
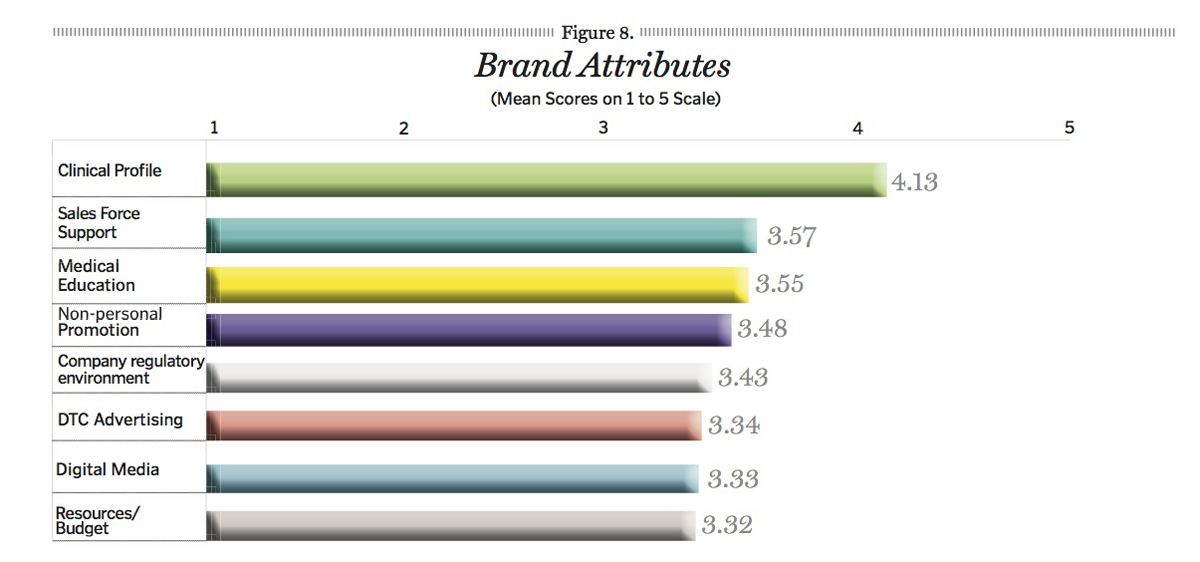
In terms of the competitiveness of individual brand attributes, only a couple of things have changed from the previous year (Figure 8). Once again, we changed the scale we asked respondents to use from 1 to 7 with 1 (Not at all Competitive) to 5 (Very Competitive) and calculated the mean scores, so we can’t make any direct comparisons. But, when looking at the ultimate rankings of how respondents judged their brands’ assets, we see one big change. Overall, 2017 respondents felt confident with their brands’ Digital Media offerings as it ranked as the third most competitive asset. This year, Digital Media swapped places with Medical Education as that moves up to third and Digital Media drops to seventh. Maybe marketers are just more focused on improving Medical Education offerings to reach physicians, or perhaps they are frustrated as they see the opportunities in digital continue to expand while they are forced to drag their feet due to regulations, especially when compared to consumer goods marketers. The only other change in the rankings: DTC swapped places with Resources/Budget, which is now last. Since we have more respondents at smaller pharma companies, it is possible they are given fewer resources to work with.
Budget Allocation
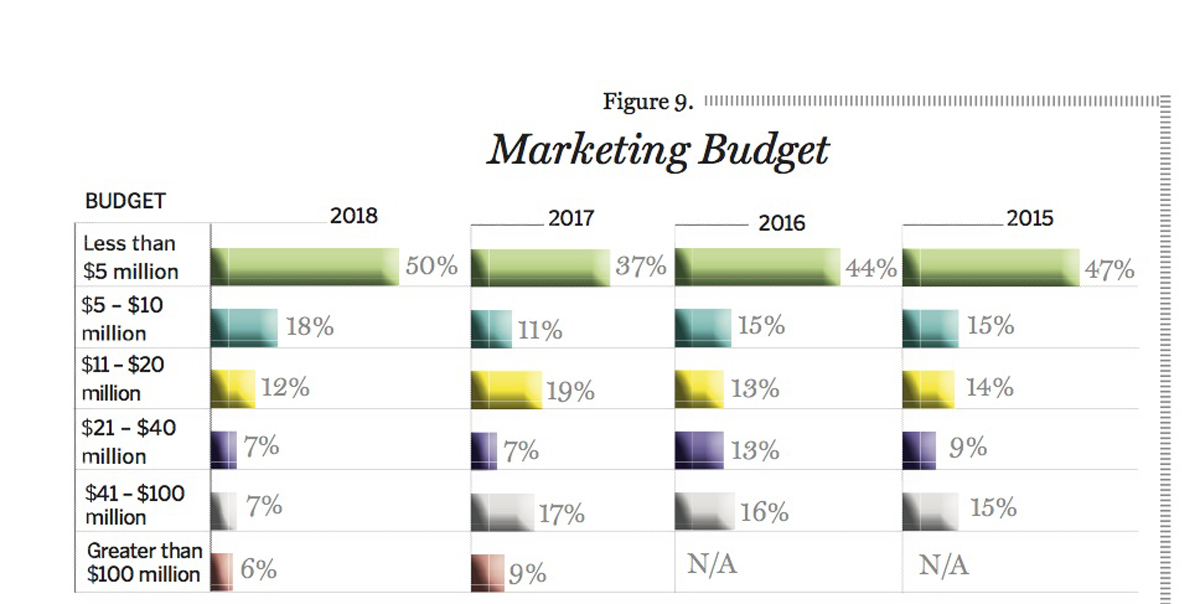
Another reason why respondents could have ranked their budget/resources as the least competitive aspect of their brand is the simple fact that their budgets are smaller than we have seen in past years (Figure 9). In fact, after three years of seeing budgets increase, often in spite of constant news reports of cutbacks within pharma, we have finally seen our respondents’ mean marketing budget dip to its lowest levels since 2014. This year’s mean of $17.3 million is a $9.8 million drop from last year when we saw a survey high of $27.1 million. At the time, we speculated one reason why we saw such a high mean was that was the first year we added a new tier to the survey: Budgets greater than $100 million. But this year, 3% fewer reported a budget that high, 10% fewer had a budget between $41 and $100 million, and the biggest change: 13% more had a budget under $5 million.
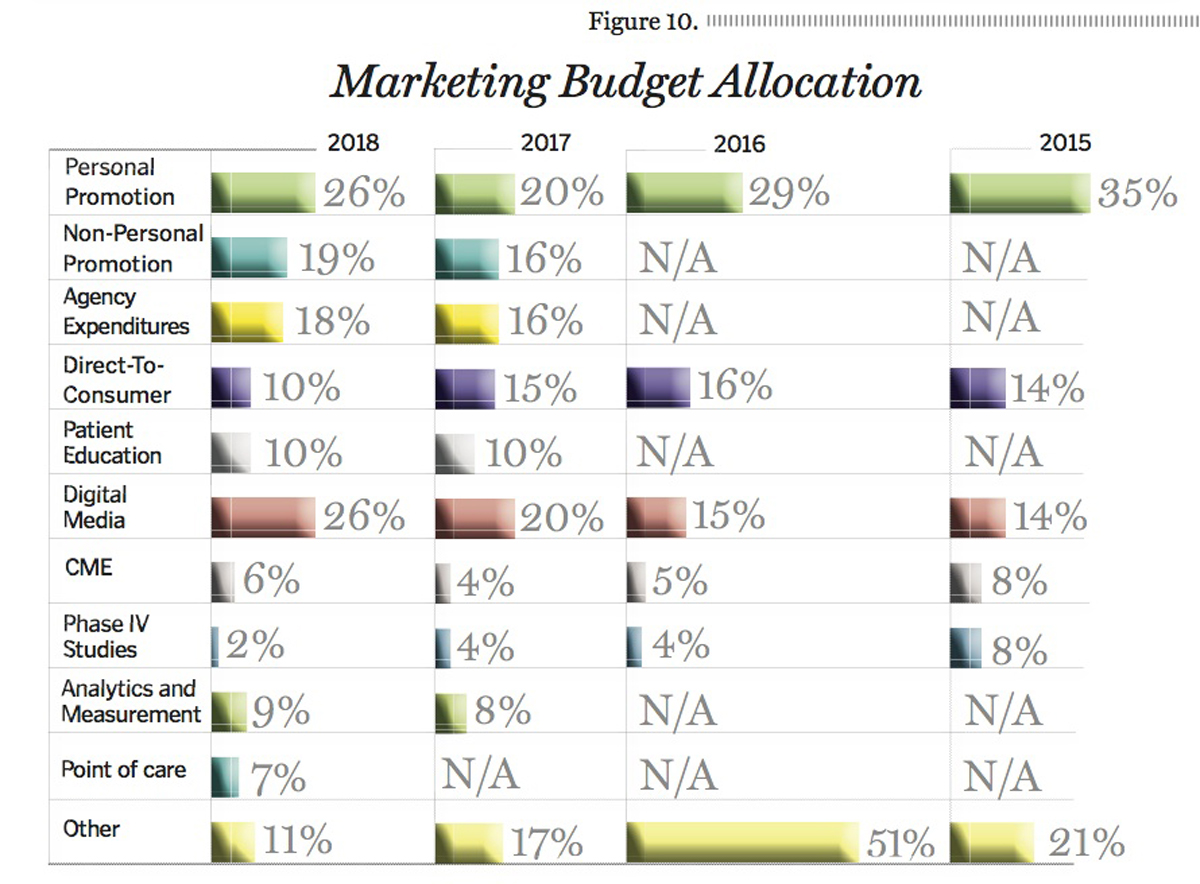
 And yet, despite the decline in marketing budgets, 56% of respondents feel their budget is adequate enough to competitively market their brand—that is the highest that percentage has been since 2012. In fact, last year with our highest marketing budget mean ever only 51% felt their budget was high enough. It’s your best guess as to the reason why—maybe this year’s respondents are just more confident in how they invest the money they are given. In terms of that investment, once again Digital Media is getting a larger piece of the pie (Figure 10). As with last year, it ties Personal Promotion as the areas receiving the most dollars—with marketers putting an average of 26% of their budget in those channels. Meanwhile, investment in DTC is down 5% and money towards Non-Personal Promotion is up 3%—nothing else changed by more than 2%.
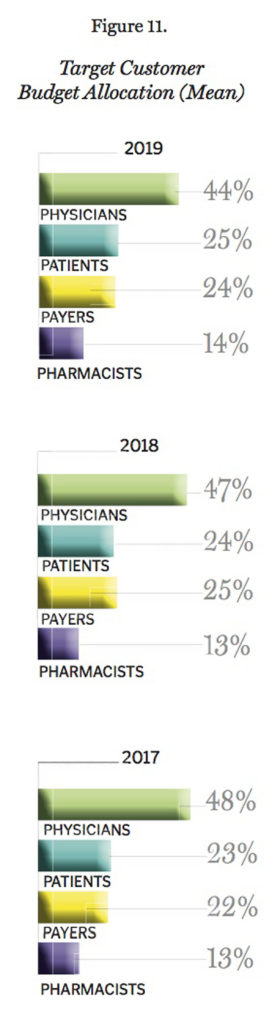
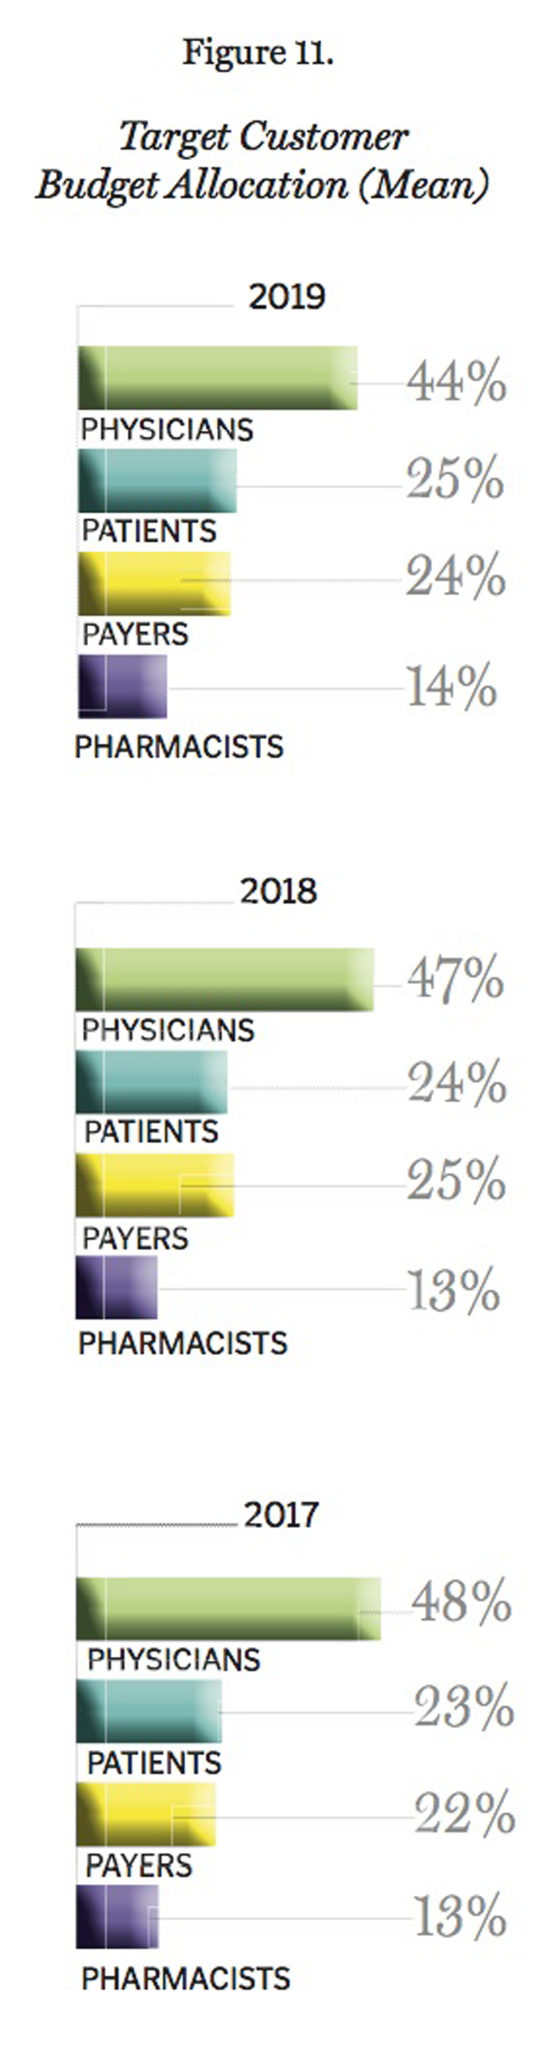
 When it comes to who marketers are investing their money in to reach, physicians are still their top target (Figure 11). But this year’s respondents are devoting more resources to reach Payers/Managed Markets. In 2017, respondents reported spending 15% of their current budget on Payers and expected to decrease that allotment to 13% in 2018. But this year’s respondents have 25% of their budget focused on reaching those making formulary decisions and plan to keep that about the same at 24% in 2019. Considering how high our respondents rated the impact of the Payer Landscape for both this year and next, it is not surprising they want to throw more resources at reaching this key target.
 Budget Changes
The plurality of respondents (37%) saw no change to their marketing budget from the previous year, while 34% experienced budget cuts and 30% had more money sent their way. That is a slight change from last year when 36% received an increase in funds and 35% were forced to work with less. But considering the lower reported budgets, it makes sense more respondents’ budgets were cut than raised.
When forced to make cuts, Digital Media was the first thing many marketers chose to slash (Figure 12). As we typically see in our surveys, the area respondents are devoting most of their dollars to is also usually the first they are willing to cut. With that said, while Personal Promotion was the other bucket marketers were putting the most dollars in, it is the fourth area most marketers want to take away from. Instead, they would rather cut from their Non-Personal Promotion efforts as well as any Analytics and Measurement they are doing—and that only received 9% of a respondent’s budget in the first place.
 Comparing last year to this year is complicated by the fact that this year, respondents were allowed to select every area they are cutting from and in 2017 they could only choose one area to make cuts from, but some interesting trends are still worth pointing out. Last year, more marketers were willing to decrease their DTC spend, but fewer would say the same this year. Of course, this year’s respondents were already devoting fewer of their resources towards DTC in the first place. On the other end of the spectrum, far more marketers were willing to cut from Patient Education, which is an area that last year’s respondents were loathe to decrease with only 3% making cuts there. One respondent wrote in that they were cutting from consumer insights, so maybe as the influence of payers is increasing, marketers are less concerned about reaching patients if they have to make tough choices. Other areas respondents mentioned cutting from include HUB services and qualitative market research.
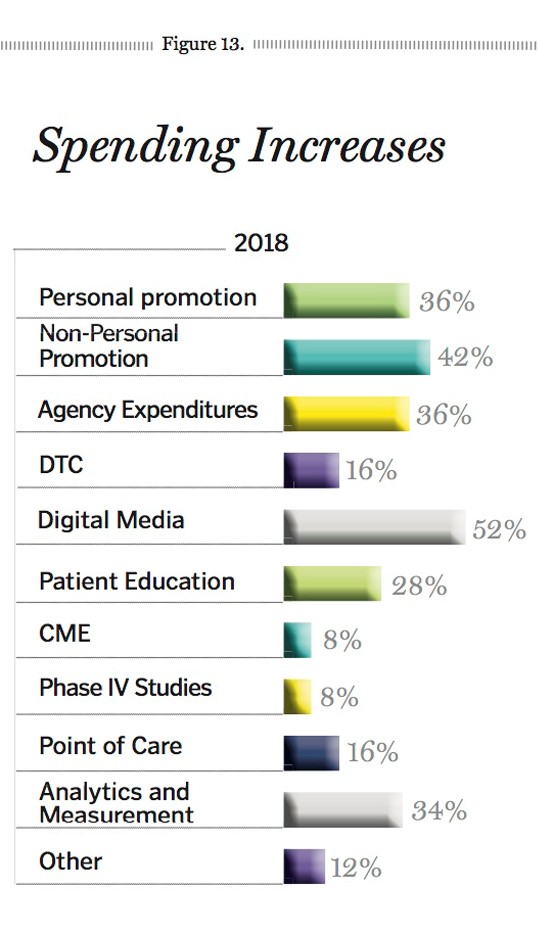
Another trend we tend to see survey to survey: The areas in which marketers are already spending a lot are most likely where they will put more money if given the extra resources (Figure 13). That means Digital Media was far and away respondents’ top choice for investing their extra cash. Non-Personal Promotion, Personal Promotion, and Agency Expenditures were also popular answers. As were buckets that receive smaller pieces of the overall marketing budget pie, such as Analytics and Measurement and Patient Education. So, while marketers are willing to lose from those areas if they have to, they also like to beef up those efforts if they can. Some of the other areas that marketers wrote in as channels they added to when given a larger budget include EHR, conferences and tradeshows, and patient access and support.
 Best ROI
In our past surveys, respondents have indicated that the main reason they pick specific channels to invest in is based on that channel’s potential ROI. And for this year’s respondents, the channel they feel offers the best ROI is their Product Website (Figure 14). Once again, we can’t directly compare this year’s results to last year since this year respondents were allowed to select multiple answers rather than just one, but in 2017, the Product Website was the second most popular answer among our respondents. For last year’s respondents, Digital Ads represented the most bang for their bucks, which is the channel that comes in second for our 2018 respondents.
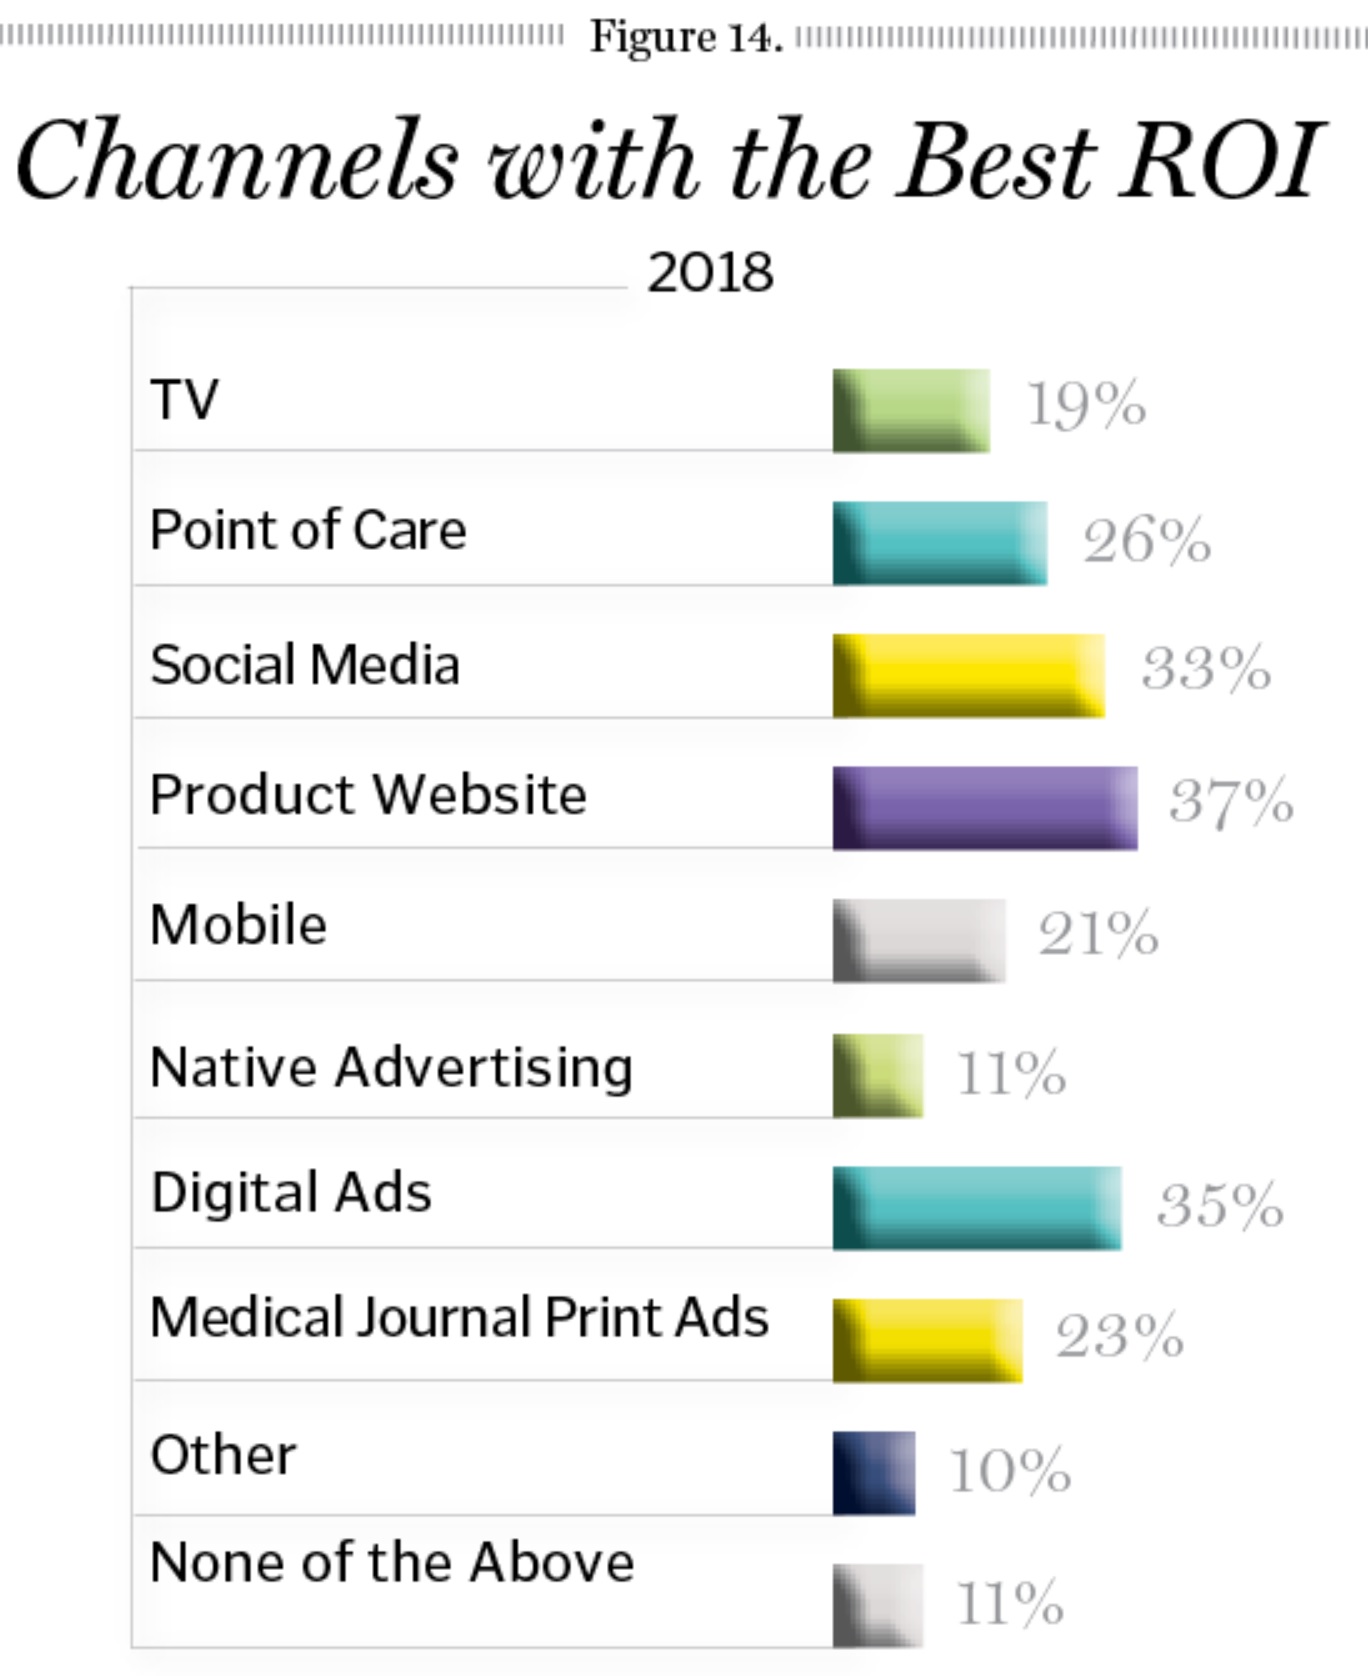 Other changes between year to year is the rise of Social Media. In years past, when we asked respondents about using social media for their brands, many responded that they couldn’t because of the inability to demonstrate ROI to their bosses. But for our 2018 respondents, they feel like Social Media offers the third best opportunity for ROI—it was fifth in 2017. The channel that dropped the most in the minds of marketers in its ability to deliver on their investment was Mobile, which ranked third in 2017, but sixth in 2018. Native Advertising came in last for our 2018 respondents, swapping places with TV, which was the channel our 2017 respondents felt delivered the worst ROI (of the options provided). The “other” top channels for ROI that marketers wrote in include advocacy sponsorship, CRM email/SMS programs, medical education, EHR, reps, and direct mail.
Novel Marketing Opportunities
We also asked marketers for which opportunities or strategies they planned to use for their brand next year. The list of options we gave them, which you can see in Figure 15, represent both newer channels as well as some that have been around for a while longer. But the goal was to try to see which channels—beyond the more traditional ones—marketers are exploring. The areas of most interest to this year’s respondents were EHR/EMR and Marketing Automation/Programmatic Buying. Meanwhile, Conversion Rate Optimization ranked third.
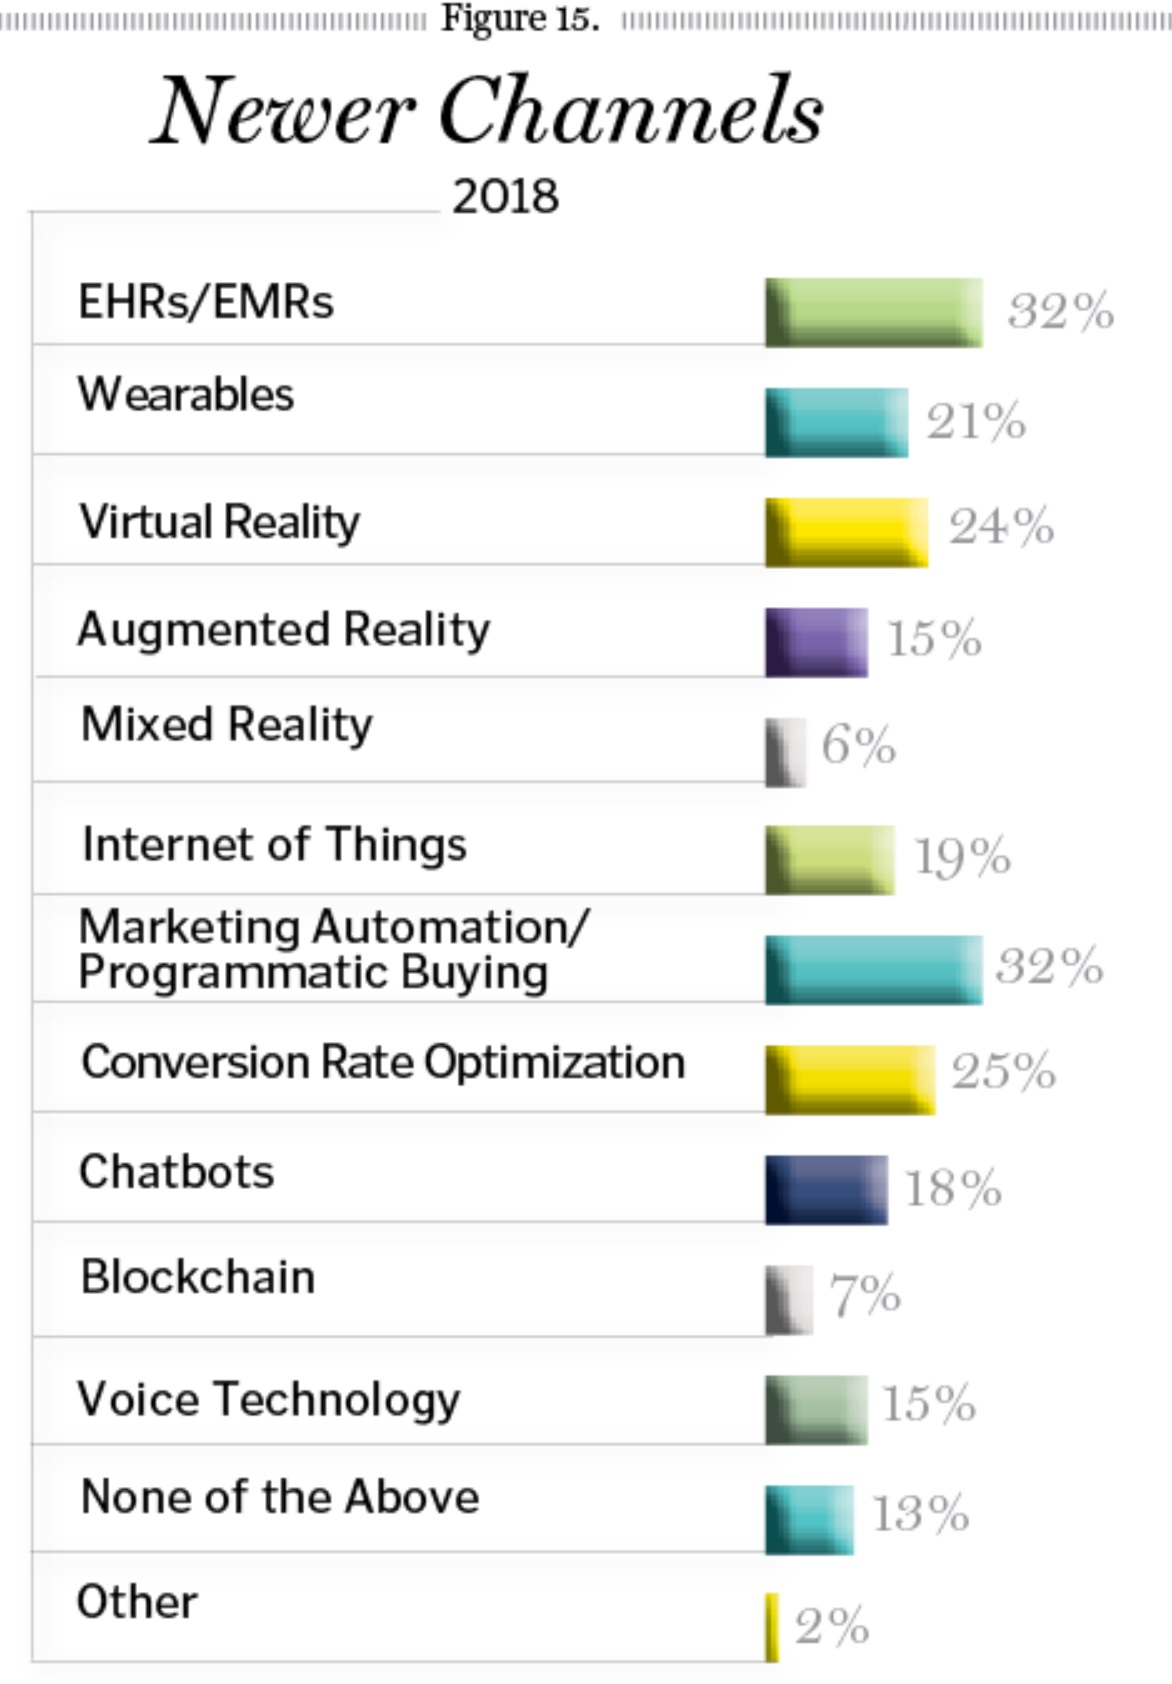 This year we added several new options, including Chatbots, Voice Technology, and Blockchain. All three have been popular buzzwords in 2018, and as of now it appears that marketers do have some interest in Chatbots (18%) and Voice Technology (15%), but only 6% plan to use Blockchain so that appears to be one tool respondents aren’t quite sure how to use yet. When it comes to the various opportunities out there to show—or bring people into—a new reality, Virtual (24%) came out ahead of Augmented (15%) and Mixed (6%). Meanwhile, 13% of our respondents don’t plan to use any of these for their brands.
Digital Spend
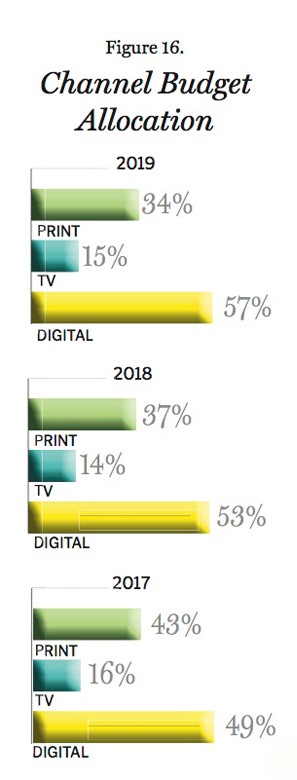
When you look back on our ROI question, it shouldn’t be a shock that between TV, Print, and Digital, the majority of our respondents’ marketing budgets are devoted to Digital (Figure 16). And that is only expected to increase in 2019, as marketers plan to up their investment in Digital channels by 4%. Meanwhile, the money our respondents put towards Print will decline by 9% between 2017 and 2019.
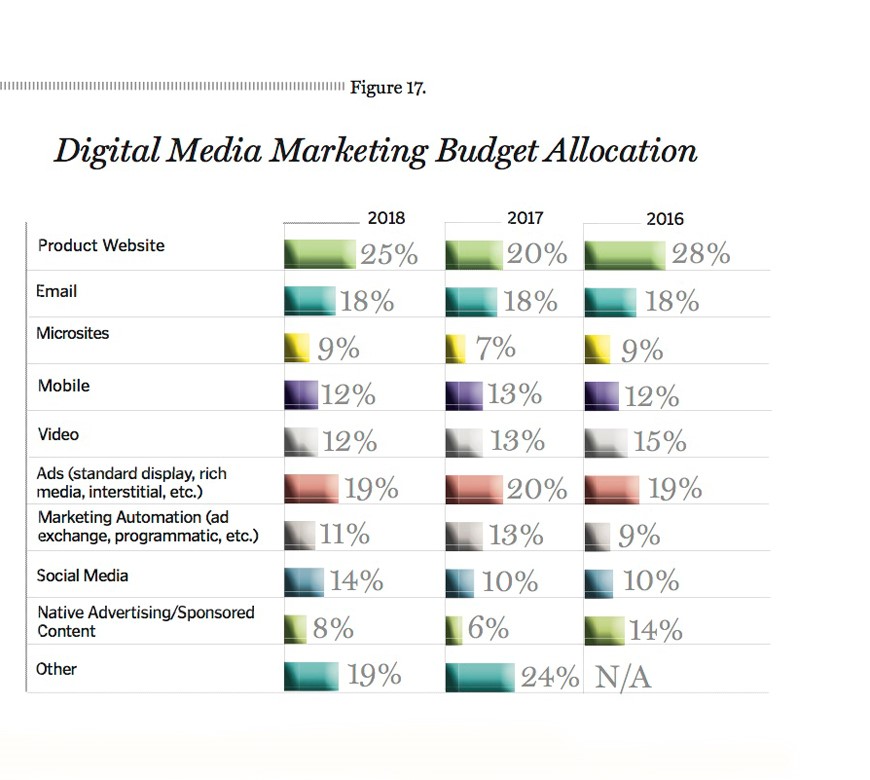
 As for where exactly marketers are spending within digital, the plurality of money is going to a brand’s Product Website with the second largest investment going to all forms of Digital Ads (Figure 17). Once again, that lines up with what we saw in response to our question about ROI. It also lines up similarly to what we saw last year, though our 2018 respondents did up their investment in Product Websites by 5%. And for the most part, this year’s respondents are allocating their dollars within the digital space very similarly to what we saw from last year’s respondents. The only real difference is a 4% increase in Social Media, which ranked higher in terms of ROI for this year’s respondents.
 Social Media
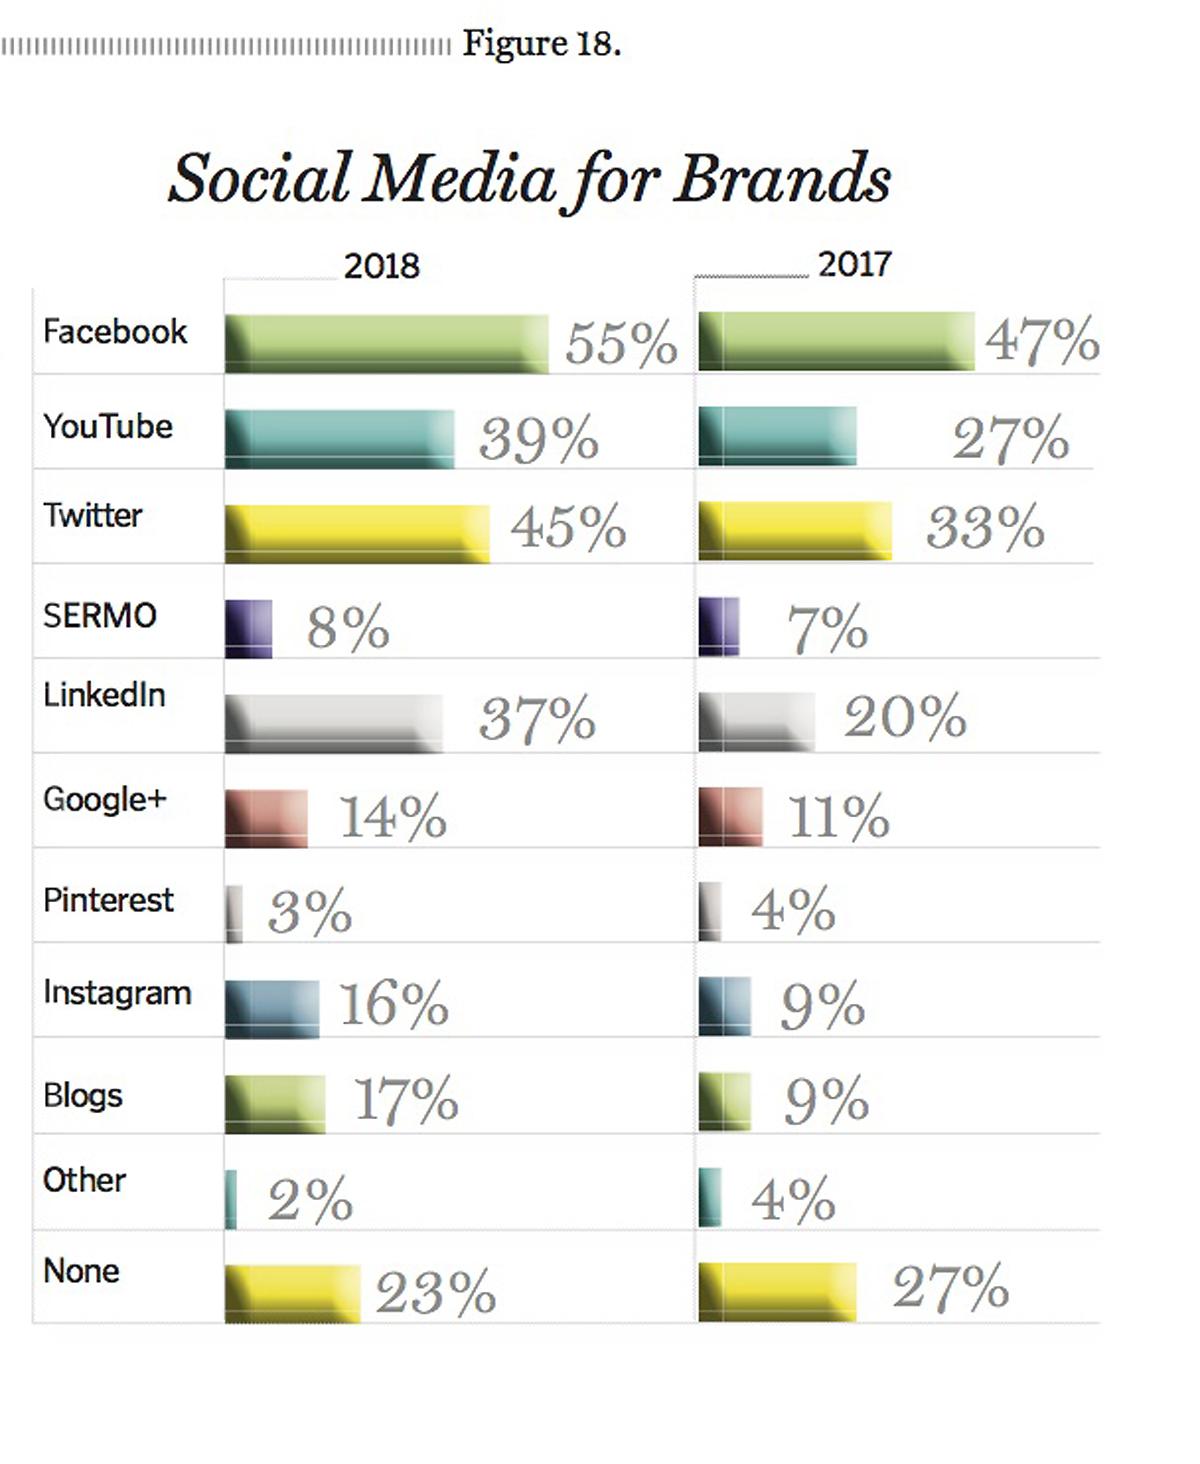
Speaking of social, use of all social channels for brands is up, with one exception—Pinterest (Figure 18). Once again, considering everything we have heard from this crop of respondents in terms of their view of social’s ROI and their investment in the channel, it only makes sense that they are using each social channel we ask about more than last year’s respondents. And in some cases, it is a lot more. LinkedIn use is up 17%, YouTube and Twitter use is up 12%, Facebook and Blogs are up 8%, and Instagram is up 7%. Even Google+ is up 3% in its last appearance on our survey as the company announced in October 2018 it will be shutting down the site after 500,000 users’ data were exposed. Now Google+ is hardly the only site to face data privacy controversy, but it certainly never came close to reaching Facebook’s popularity. And considering our respondents’ use of Facebook, it doesn’t seem as if that company’s data controversy has turned marketers away from the site—not yet at least.
What’s on the Horizon
Are the machines ready to take over? Or at the very least just help make marketers’ jobs a little easier? Well, 10% of our respondents think so as they named Artificial Intelligence as the hottest new trend (Figure 19). And while that wasn’t the most popular answer, it was the one that saw the largest increase from past years. Prior to this year, AI was only mentioned by one person—back in 2016. For the most part, respondents see AI as helping with their ability to understand and use data. For instance, one said, “Marketing automation integrated with AI, mobile, and programmatic.” While another mentioned using AI with “predictive analytics” and another said “using machine learning for targeting.” Meanwhile, one respondent sees the integration of big data and AI helping to optimize/maximize investments.
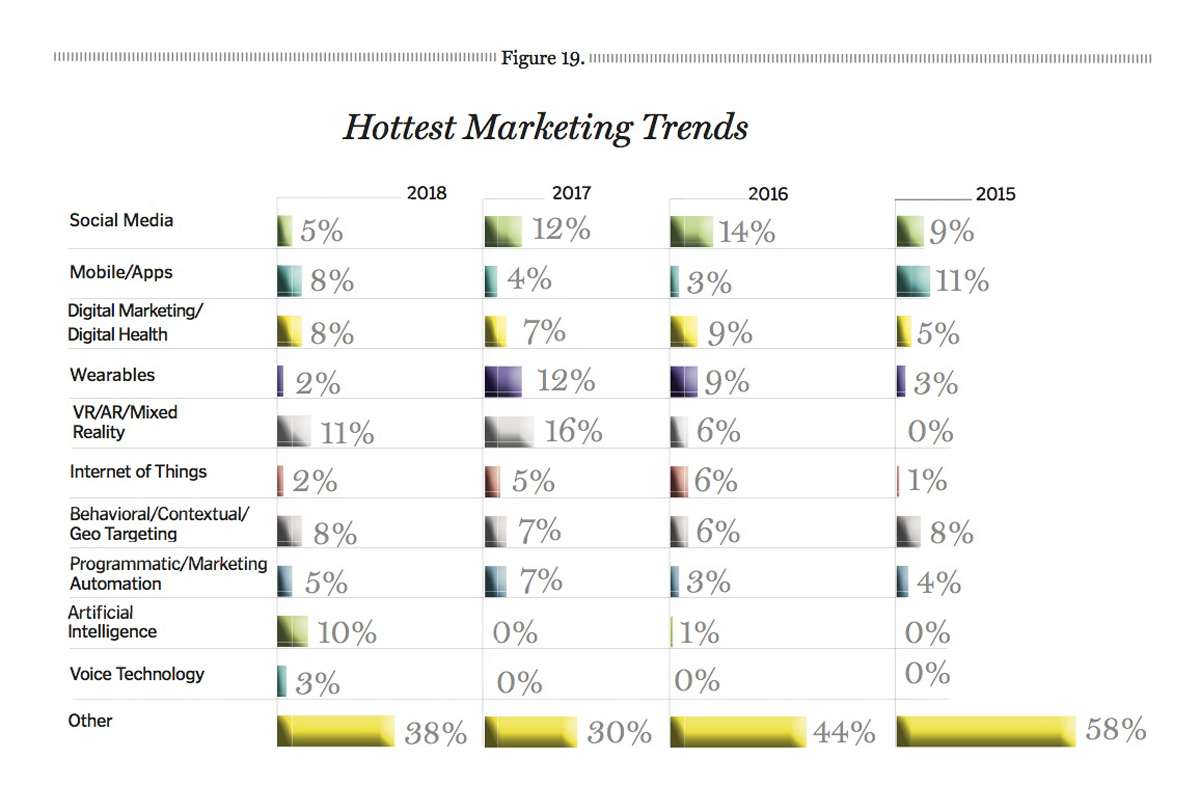 This year’s most popular answer was the same as last year: Virtual, Augmented, and Mixed Reality. However, it wasn’t quite as popular—it was only named by 11% of respondents compared to 16% last year. Other “hot new trends” that were named by fewer respondents this year include Social Media (a decrease of 7%), Wearables (down 10%), and Internet of Things (down 3%). Of course, it is possible this year’s respondents just don’t consider any of those areas to be new. That may be especially true in the case of social media, since so many respondents are already using it. But this year’s respondents were also more specific in relation to social media. In the past, most simply just wrote “social media.” This year, someone specifically mentioned using Instagram more, while another said using more targeted promotion through social channels.
One channel that isn’t particularly new that got more mentions compared to last year: Mobile/Apps. However, some respondents were quite specific with what they see coming in that area. One said, “Apps that directly connect us with our client, cutting out our competitors.” Another respondent believes we will see more wellness apps. And one mentioned using location-based services via mobile. Several others, 8% to be exact, also mentioned using more geotargeting or geofencing, just not specifically in relation to mobile.
Some of the other trends that only garnered a couple of mentions from respondents include Alexa skills or voice tools, chatbots, and EHR. Meanwhile, single mentions of things worth keeping an eye out for included Blockchain, cannabis, CE sessions sponsored by pharma, implanted devices, value-based contracts, third-party educational platforms, touchpoint optimization, viral marketing, wine and cheese parties, and 360° view of customer data and touchpoints with the company. One person mentioned sampling, while admitting it isn’t very new. And another said going back to basics with snail mail.
But, as always, a few respondents claim there just isn’t anything new. One said, “Nothing really that new or impactful. Most of the new trends are fads using analytics to prop up lame results. Agencies pushing fantasies to cover up their lame performance and importance. Physicians drive the real market.” And another said the key is, “working hard—getting the millennials not to complain and stay in a position longer than six months.”
Thanks To Our Respondents From These Companies
3M
AbbVie
AboGen, Inc.
Acorda Therapeutics, Inc.
Aesculap
Alimera Sciences
Allergan
AMAG Pharmaceuticals
Antares Pharma, Inc.
Astellas Pharma US, LLC
AstraZeneca
B. Braun Medical
Baxter
Bayer
Bayer Radiology
Biogen
Boehringer Ingelheim
Boston Scientific
Breckenridge Pharmaceutical, Inc.
Bristol-Myers Squibb
Centocor, Inc.
Chiesi USA
Clovis Oncology
CoMeg Partners
CSL Behring
Depuy Synthes
Diagnostica Stago, Inc.
Dynacell Life Sciences, LLC
Eagle Pharmaceuticals
Eisai
Eli Lilly and Company
EMD Serono
Exeltis USA, Inc.
FemmePharma
Ferring Pharmaceuticals
Galderma
Genentech
Genzyme
Gilead Sciences, Inc.
GSK
Hologic
Horizon Pharma
InterMetro Industries Corporation
Isto Biologics
Janssen
Jazz Pharmaceuticals
Juno Therapeutics
Kimberly-Clark
Matrx Pharmaceuticals, Inc.
Merck
Mission Pharmacal Company
Monte Sano Pharmaceuticals
NeoGenomics
Neos Therapeutics, Inc.
NGM Biopharmaceuticals
Novartis
Ortho-McNeil Neurologics
PDI Healthcare
Pfizer
Roche Diabetes Care, Inc.
Siemens Healthcare
TESARO Bio GmbH
Teva
Upsher-Smith
Validus Pharmaceuticals